Analytics & Conversion Strategy
- 12+ years building data-driven design culture
- 60% → 92% conversion improvement on key flows
Over the course of 12+ years, I led the evolution of our department’s approach to member data and UX analytics. Starting with no behavioral tracking, I established tools and processes to measure member interactions, uncover friction points, and guide design decisions. This initiative expanded from a single portal project into a company-wide strategy, giving teams actionable insights to optimize conversion, reduce call center volume, and improve member satisfaction.
In 2012, our member portal served hundreds of thousands of users—but we were operating completely blind. No behavioral tracking. No conversion metrics. Just an avalanche of complaints flooding our call center, message center, and even landing in leadership’s inboxes. When executives asked ‘Why are members struggling?’ we had no data—only anecdotes and guesses.
The Business Cost:
The User Pain:
Members were frustrated enough to call support repeatedly, send portal messages, and email leadership directly. *But we had no way to understand the scale of these problems or prioritize fixes.*
Why This Mattered Now:
"I saw an opportunity: if I could implement tracking and feedback mechanisms, we could transform complaints into actionable insights."
I started by pitching the idea to our dev team, marketing, and customer service center—and they immediately got it. Everyone was hungry for better data. The developers wanted to understand technical issues, marketing wanted engagement metrics, and CSC wanted to reduce call volume.
But implementing Google Analytics was just the beginning.
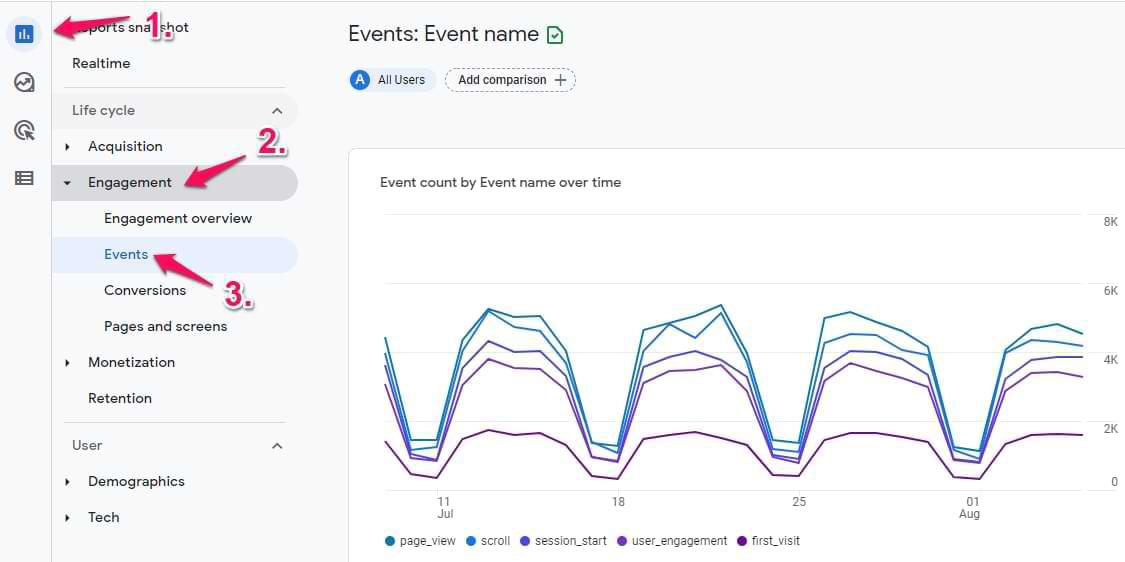
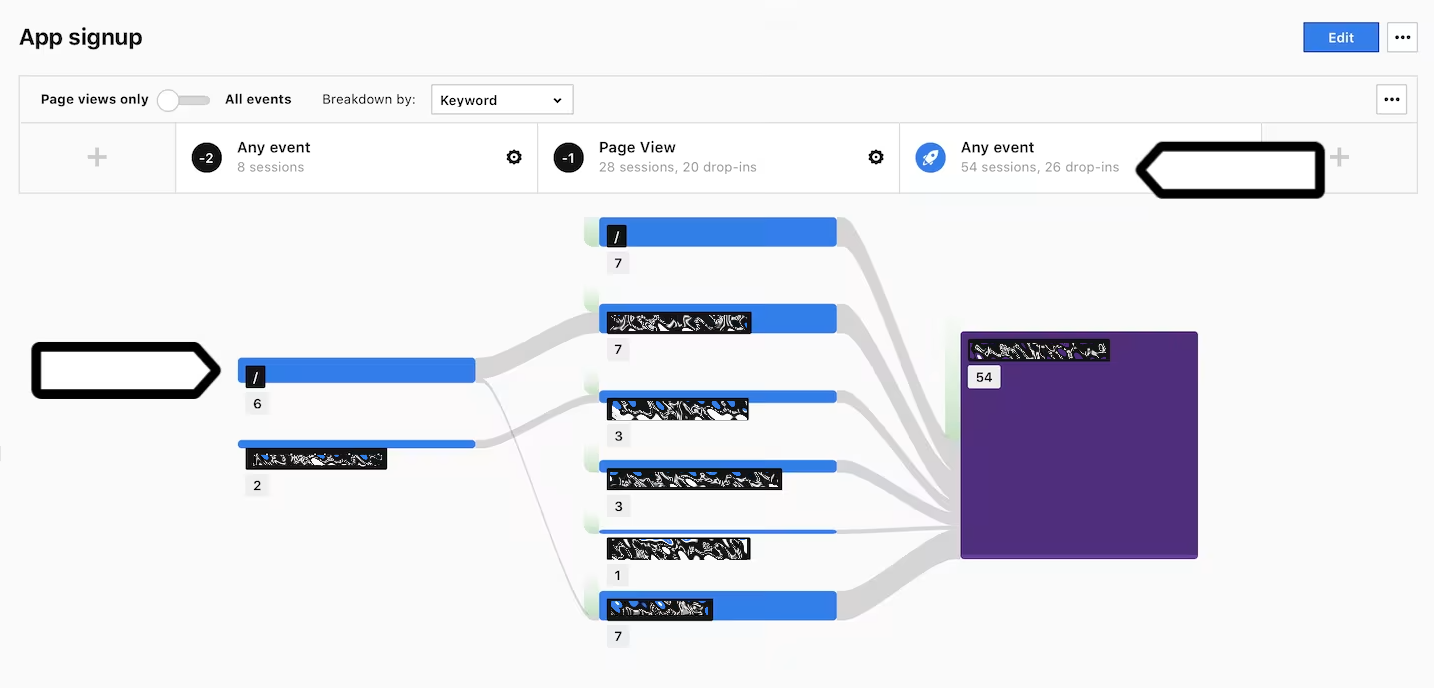
The real breakthrough came when I introduced **custom event tracking**. Standard pageview data wasn't enough—I needed to understand specific member behaviors: Did they click 'Help'? Did they abandon at a specific form field? Did they use the search function?
What I Did:
"Suddenly, we could answer questions like: ‘Where exactly are members getting stuck?’ The data revealed patterns we’d never seen before."
With early wins proving value, I expanded tracking across the portal. I embedded feedback buttons at key friction points and trained teams to interpret event data.
One finding was particularly revealing: on certain complex pages, members clicked ‘Help’ 3-4x more than anywhere else. This wasn’t just a usability problem—it was a crisis point we’d been completely blind to. The custom event data made the invisible visible.
Collaboration:
I worked closely with product, dev, and customer service teams to:
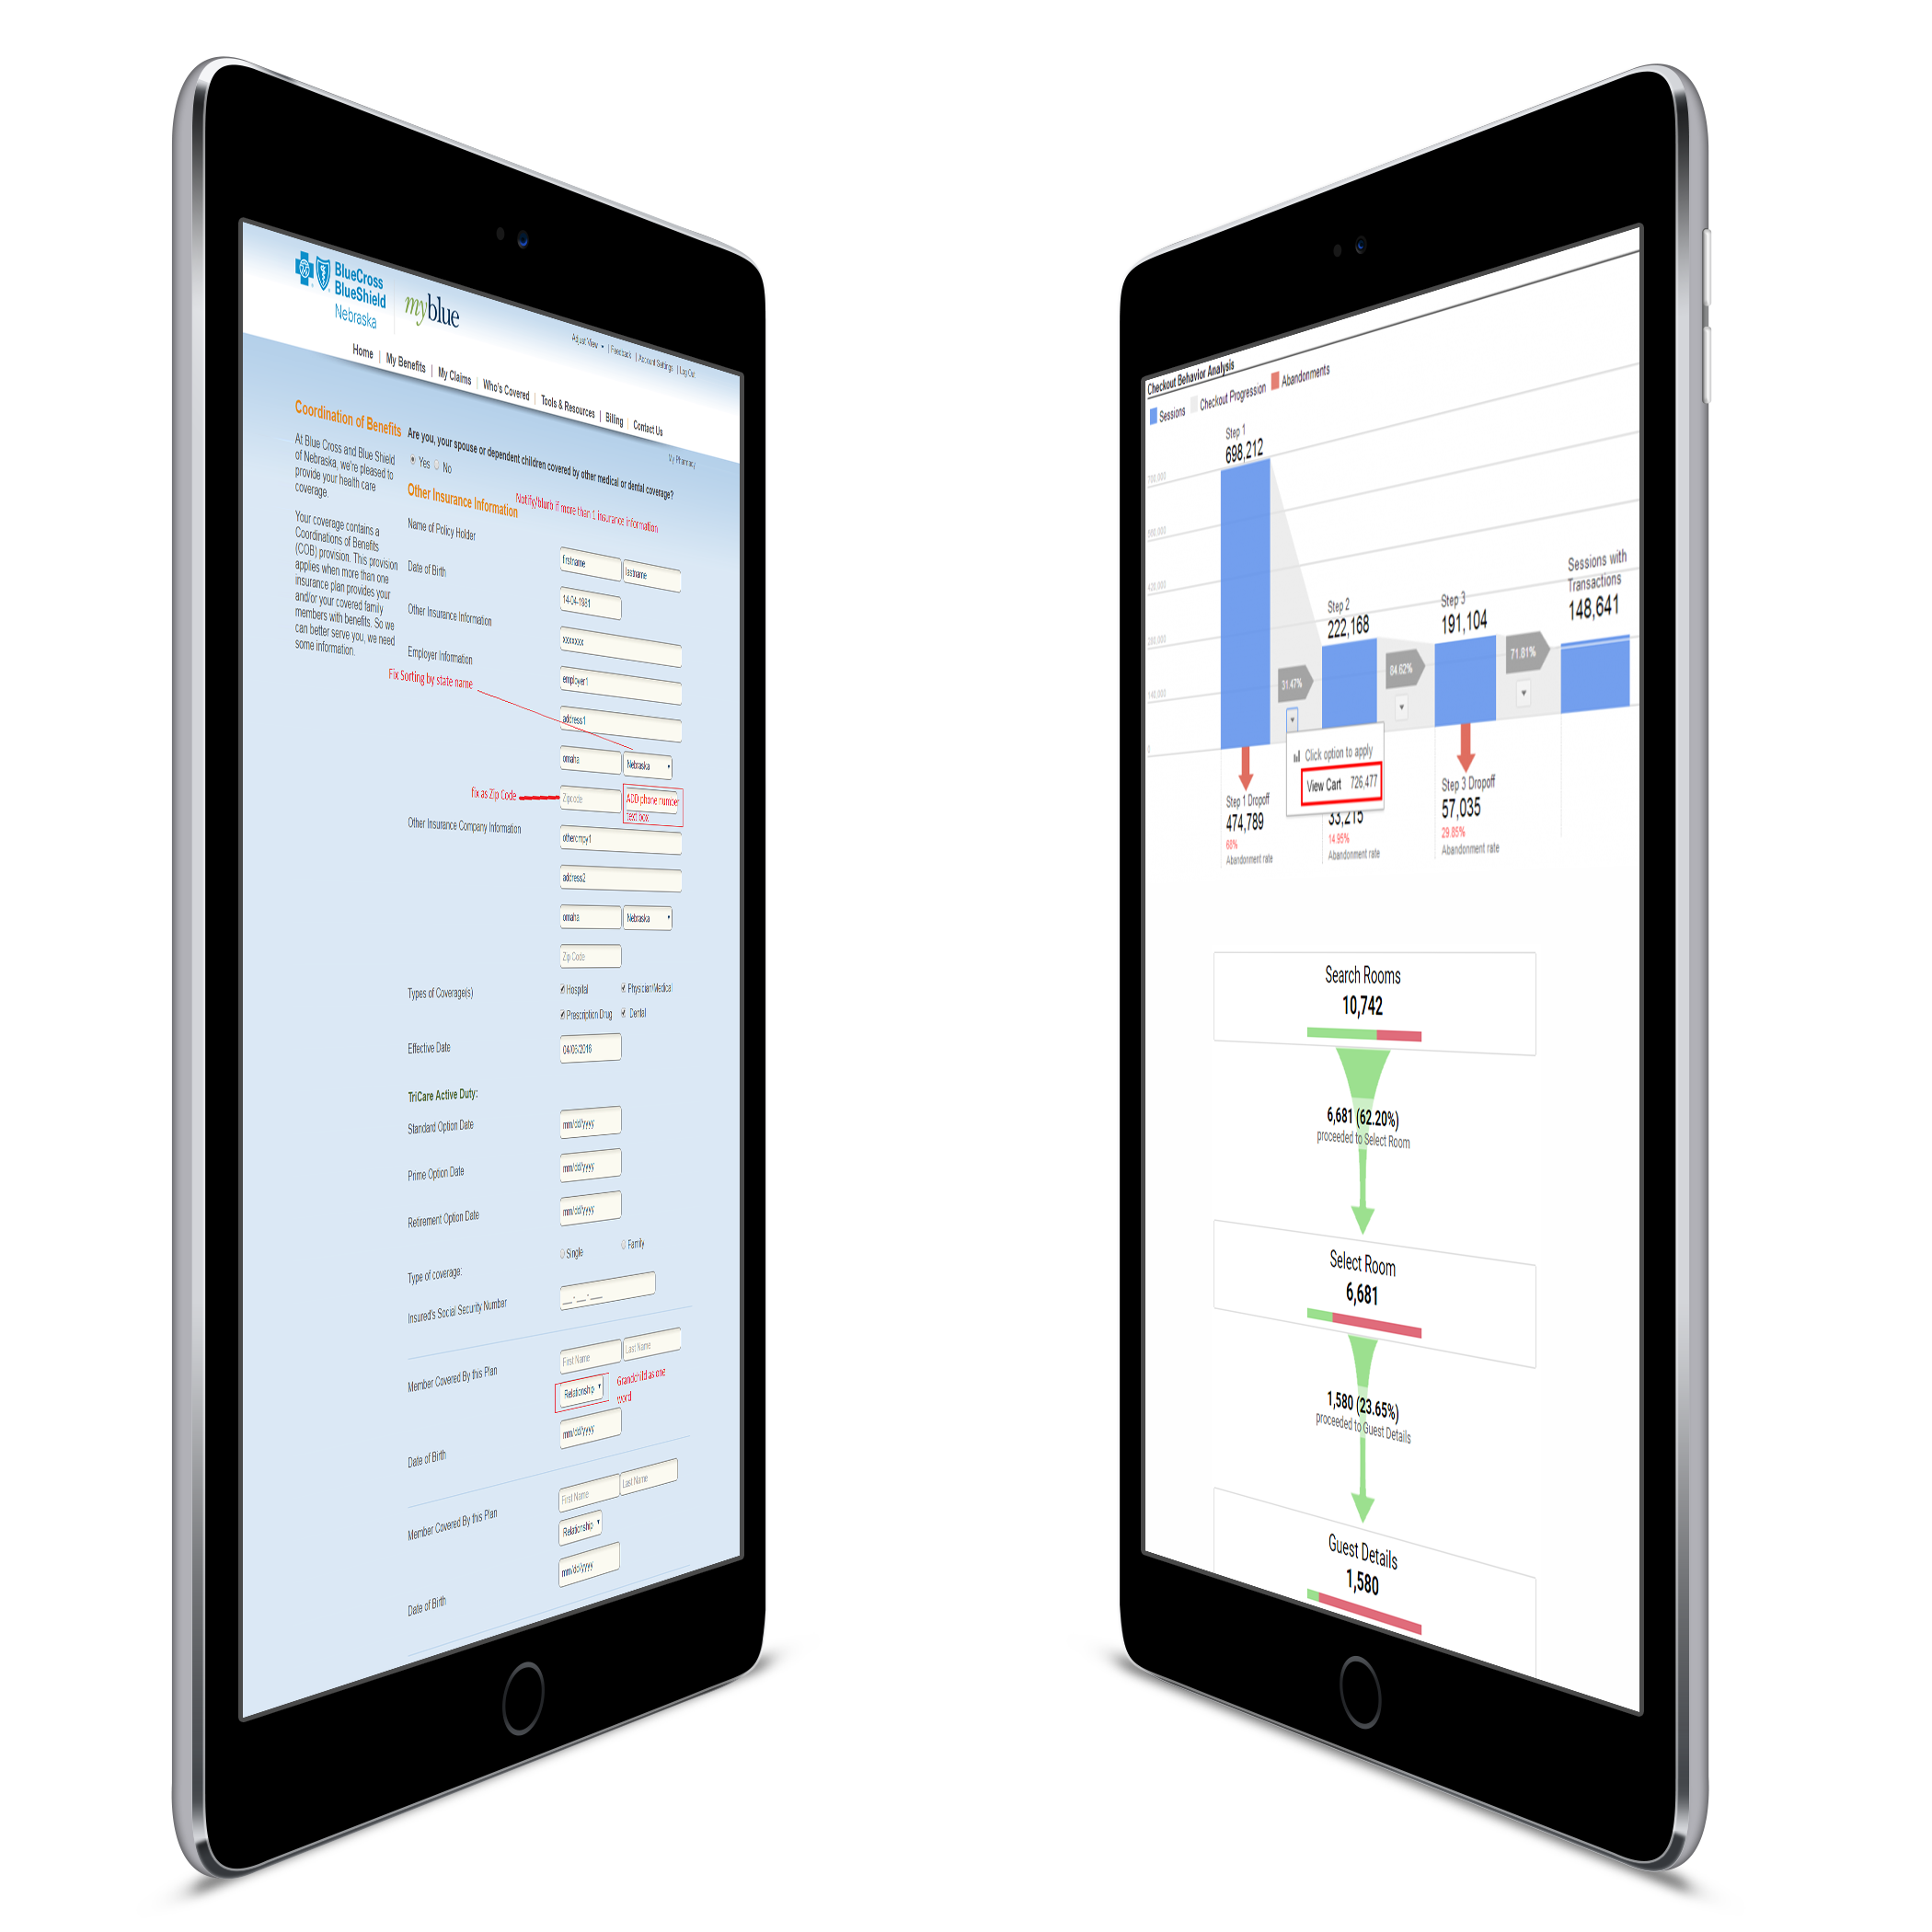
Armed with data, I identified our biggest conversion killers: Coordination of Benefits and Registration flows were hemorrhaging users.
The COB Flow Success:
Through iterative testing and cross-team collaboration, we redesigned the flow. Conversion jumped from ~60% to over 90%.
Obstacle & How I Overcame It:
Convincing business stakeholders to invest in redesigning these flows could have been tough. Fortunately, I had some allies: a CX director and product owner who championed the business case to leadership while I focused on design and testing.
By 2022, what started as a single portal experiment had become enterprise gospel. Leadership launched a company-wide analytics initiative—and asked me to lead the expansion.
My Leadership Role:
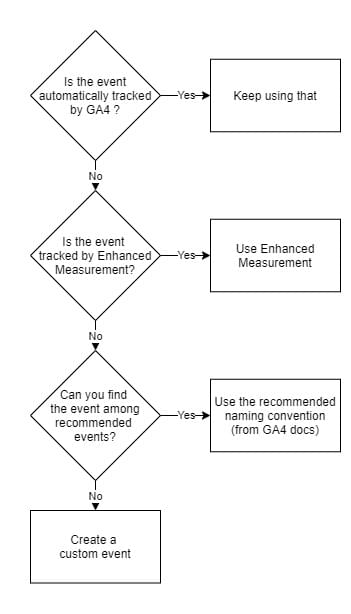
I became the internal consultant, helping teams understand not just how to implement Google Analytics, but how to design meaningful custom events that would actually drive decisions.
The registration redesign showcased both the power of data and the reality of organizational constraints.
The Prototype Success:
Through user testing and iteration, I redesigned the registration flow. Conversion improved from roughly 20% to over 90% in prototype testing.
I was thrilled. The data was undeniable.
The Setback:
I created a comprehensive presentation for our Head of Digital, complete with user testing results, conversion data, and implementation recommendations.
It wasn’t approved.
Multi-factor authentication remained embedded in the flow, causing confusion and keeping production conversion at only ~45%.
Years Later—The Resolution:
When we migrated to a new development technology, I finally had my chance. I redesigned the flow again, this time moving MFA out of registration entirely and into the app’s internal onboarding.
What I Did:
The Constraint:
Resource limitations prevented formal user testing on this iteration, but the event tracking data clearly showed improvement.
What This Taught Me:
Even when you have the data and the solution, organizational readiness matters. Sometimes you need to wait for the right moment — a technology shift, a leadership change, or a strategic priority—to implement what you know is right. Persistence and timing are just as important as design skills.
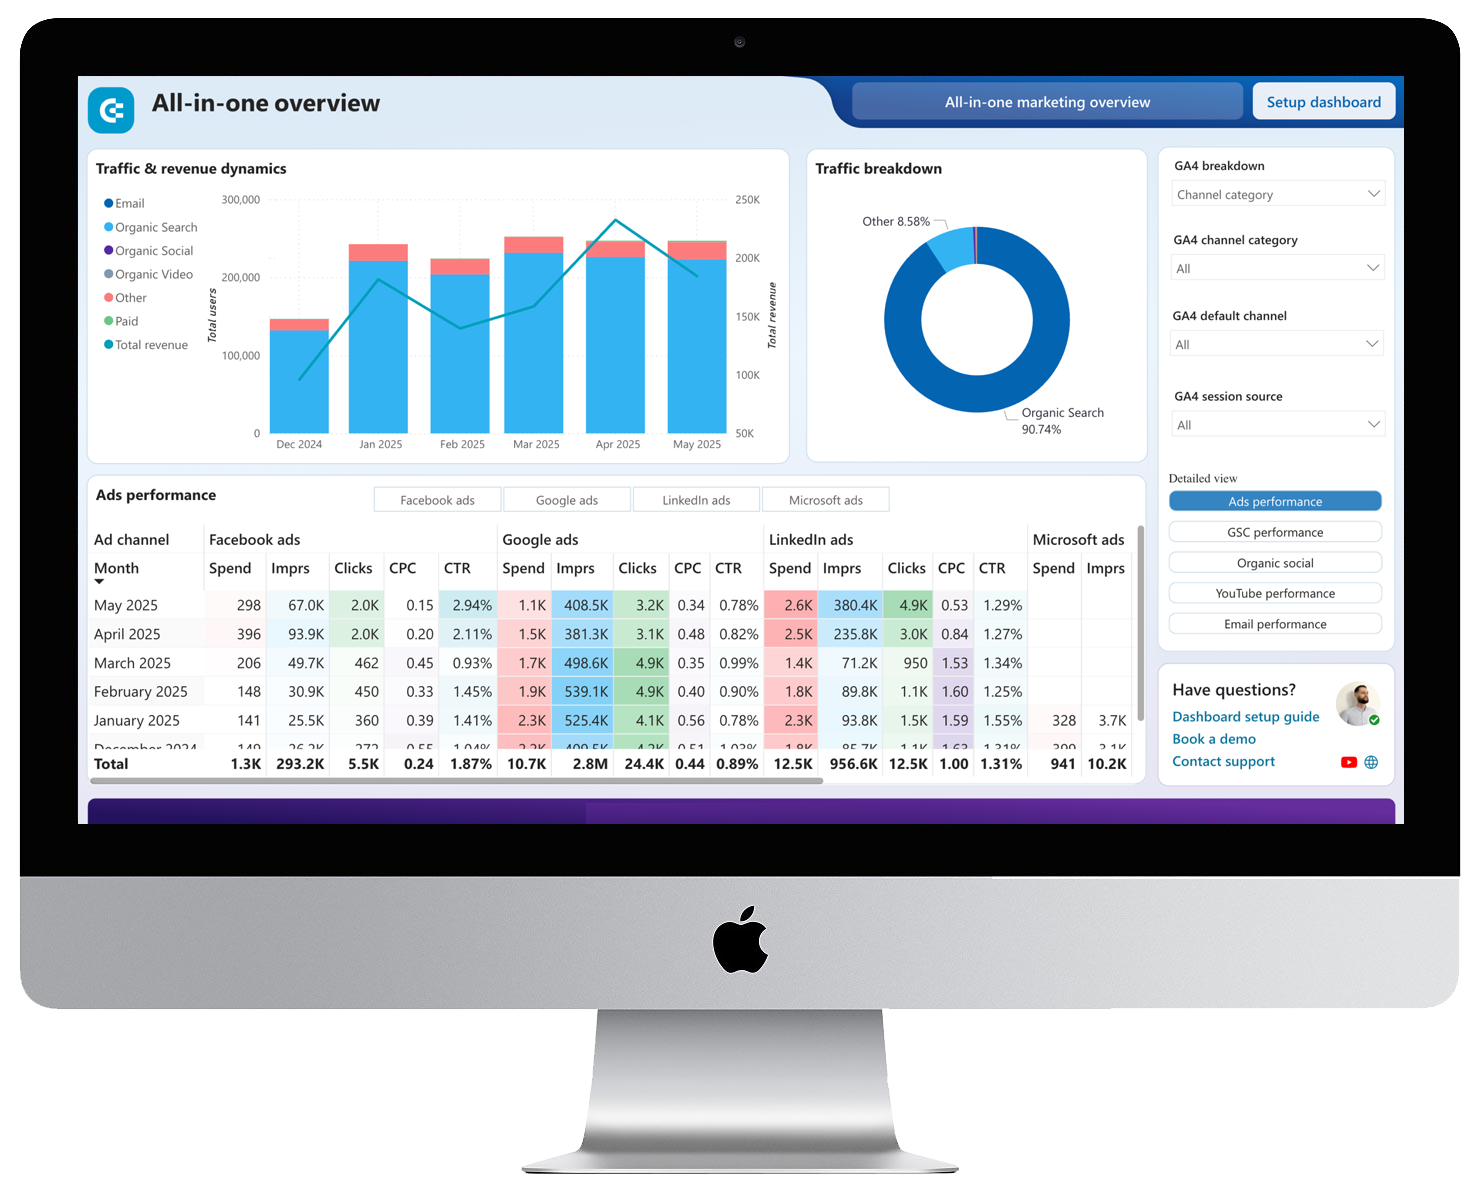
Over 12 years, I transformed a metric-blind organization into one where data-driven decision-making became standard practice across every digital product.
This project is the one I’m most proud of. Over more than a decade, I built a foundation for data-driven decision-making in an organization that initially had no metrics, no behavioral insight, and limited but emerging UX culture.
The real breakthrough wasn’t just implementing Google Analytics — it was teaching teams how to design and interpret custom events that revealed true member behavior. That framework's foundation became the backbone of our enterprise analytics strategy.
At the time, much of this work went unnoticed—especially the setbacks, like the registration redesign that sat on deck for years. But reflecting now, I can see the tangible impact on both members and the organization.
This experience taught me that persistence matters as much as design skills. Sometimes the best solution has to wait for the right organizational moment. It reinforced why I’m passionate about using data to inform decisions, drive outcomes, and elevate the member experience—even when progress feels slow.
I’d involve call center teams earlier — their frontline insights would have accelerated learning. I’d also invest more in building stakeholder business cases; not every champion like our CX director will be there when you need them.